March 8, 2021
We are excited to announce a new tool within Purple Mash – 2Survey. 2Survey can be used by both students and teachers for creating online surveys and compiling and analyzing the results. Created surveys can be set as 2Dos, embedded in 2Blogs or 2Email, or set as a shared link for other Purple Mash users to complete.
Some actions within 2Survey are not available to students for safeguarding reasons, so students cannot create text answer questions (open-ended questions). This is to prevent students from asking for private information such as an address or password.
Users can create surveys with the following questions:

Multiple Choice
Single Choice
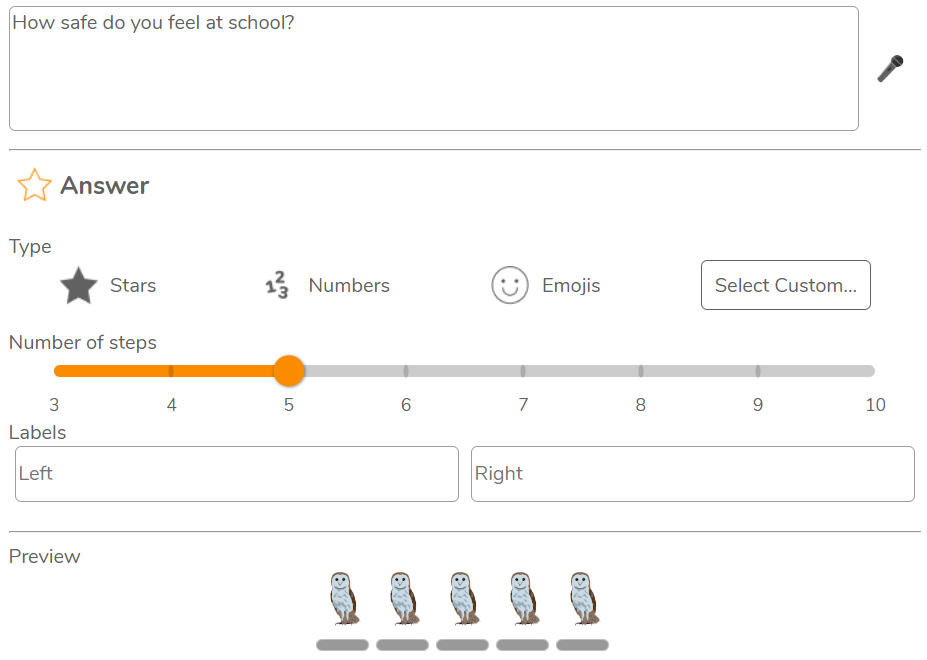
Star Rating
Text Entry (teacher only)
It is easy to get started with 2Survey. First by selecting the type of survey that you would like to create and then adding questions, you can also copy existing questions as well as adding images to the background of the survey.
You can then add a title, image and instructions for your survey as well as any required privacy information regarding anonymity and how the data will be used. The user guide sets out clearly how the different surveys can be created.
Once a survey has been created and saved to your work folder you are able to click on the play button to view the survey in preview mode. Making changes is easy, hit the stop button, edit and click save and then preview again until you are happy with the survey.
There are several ways to share your survey. These are the same as the ways that you can share any work in Purple Mash. You need to decide at the outset how to do this for all users who will complete the survey. You cannot set a survey to be completed by some students as a 2Do and some students from a sharing link as the data will not amalgamate for the two sets of students. Users completing surveys must be logged into Purple Mash to complete.
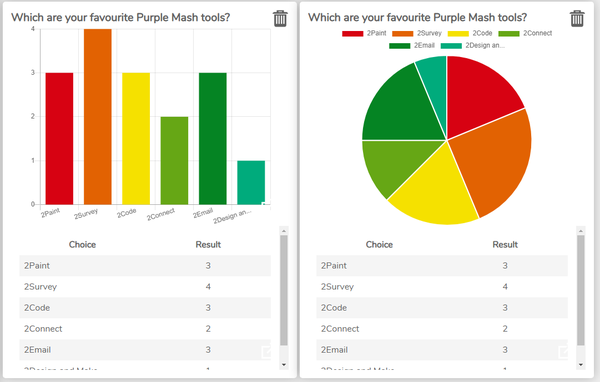
All the data is returned to the person who created the survey, you can filter the results by questions and also by date to see the results that were completed during a particular time period. Data can be presented and analysed using the in-built graphing tools. You are also able to compare two datasets. For example, selecting a subset of students compared to all students; comparing one date range to another; or comparing a bar chart of the data to a pie chart. Data for a student-created survey is anonymised and data for a teacher created survey allows teachers to see who answered what.