
Sept. 27, 2021
Each month we will be highlighting a #MashoftheMonth, this will focus on a tool or application within Purple Mash and how it can be used within the classroom to support learning across the curriculum. During the month, if you share how you have used #MashoftheMonth, you will then be entered into a draw to win a 2Simple Goody Bag!
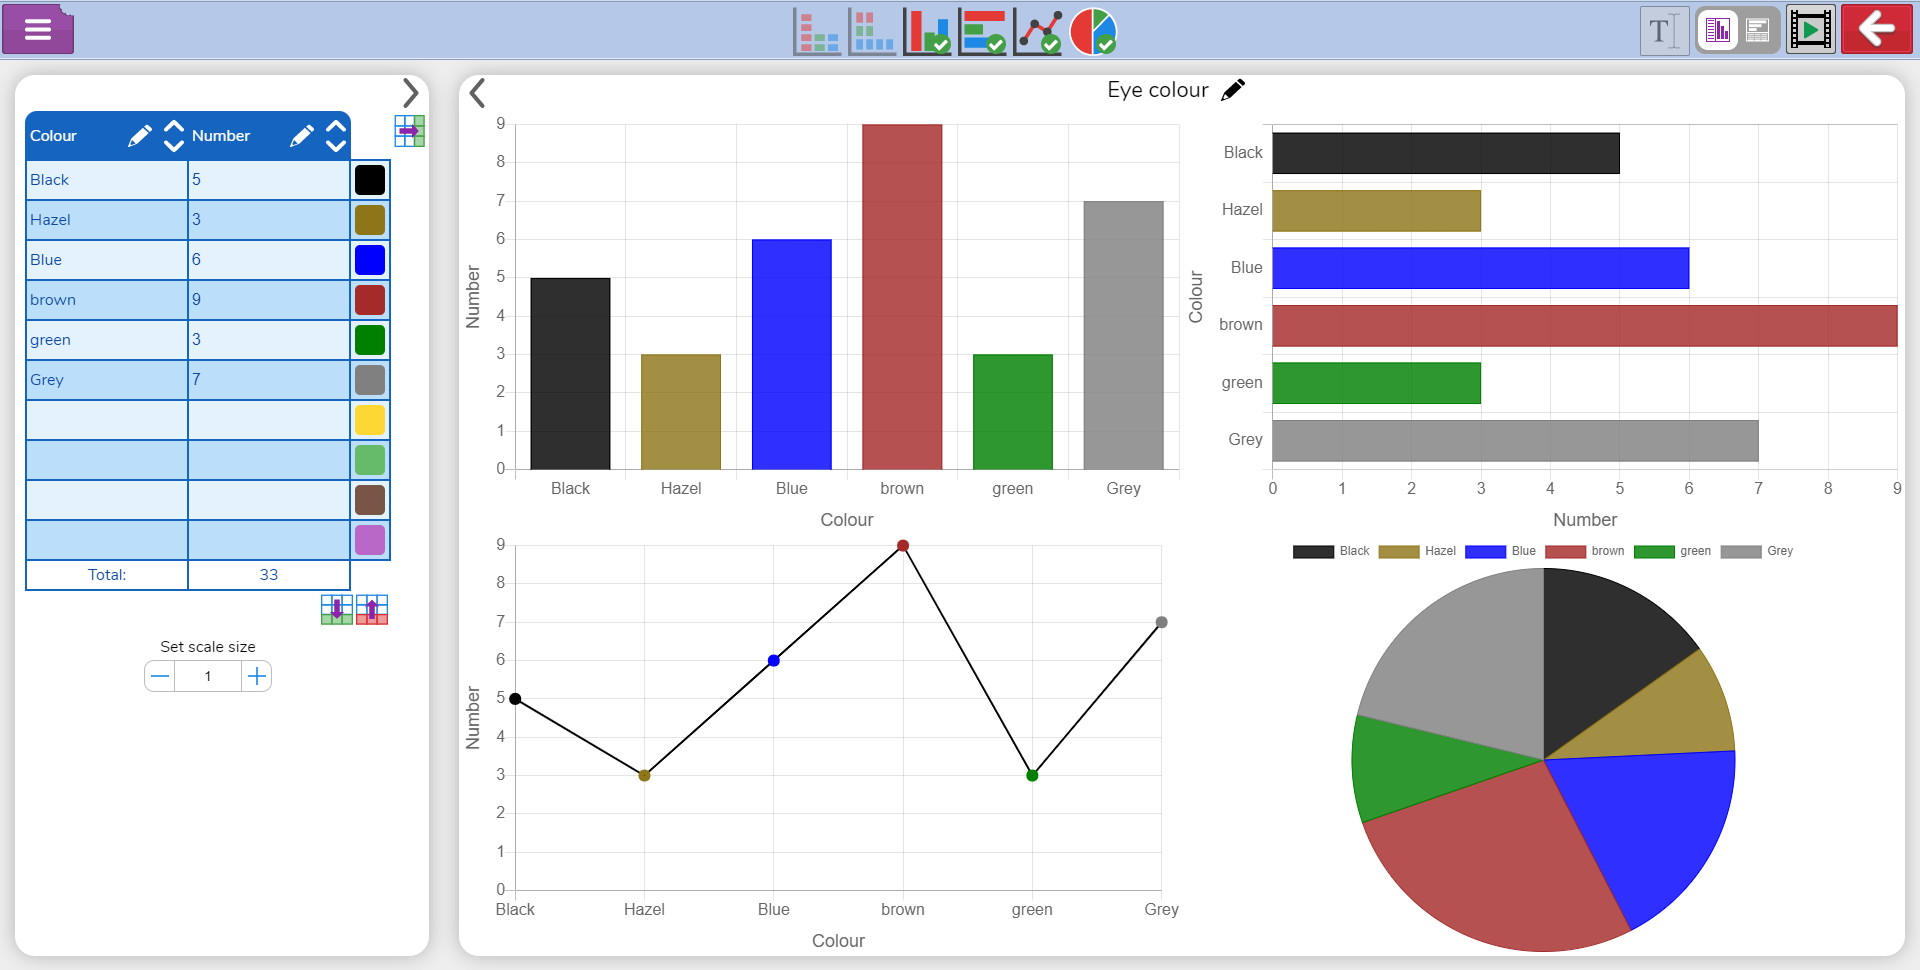
This October the Mash of the Month is the recently updated graph and chart tool 2Graph.
The new functionality lets children visualise and present data in a variety of colourful and exciting ways, giving them the opportunity to easily create a range of graphs. Different graph types can be displayed from the data entered in a table and up to four types can be shown simultaneously on the screen. Additionally, children can add more than one data set per a graph, giving children greater flexibility to compare and make inferences from data collected.
Discover all the new features in this overview video:
From block graphs, line graphs and pie charts, it is easy for children to present their data with 2Graph, and with the option to display more than one graph type, it provides opportunities for the children to compare and identify the best graph type to present their data.
This also presents an easy way for teachers to show children data in different formats and explore the data and discuss the best options whether it be data handling in Maths or using data from Science Investigations.
Within 2Graph, children can also add additional data sets to make comparative judgements between groups. Data can be sorted at the click of a button with options to write notes about the the date presented on the screen. These notes are also shown when the graphs are printed.
There is also the option to stack graphs and tables vertically as well as horizontally. When using 2Graph to display recordings from maths and science investigations it is now possible to add negative integers to your data set, with everything displayed on either side of your 0 axis in the same graph.
All its updates and enhanced features make 2Graph the perfect tool for data handling across the curriculum, visually perfect for younger students and perfect for more advanced date handling for older students.
However you use 2Graph, we can’t wait to see how you use our #MashoftheMonth this month – you can share examples via our Twitter or Facebook pages. All examples will be entered into our monthly draw to win a 2Simple goody bag!