2Graph gets a big update
Sept. 8, 2021
Purple Mash’s graph and chart tool 2Graph just got a big update and we’re really excited about it. The new version is packed full of new functionality that lets children visualise and present data in a variety of colourful and exciting ways.
Let's take a look at each of the new features:
Improved user interface and graphics
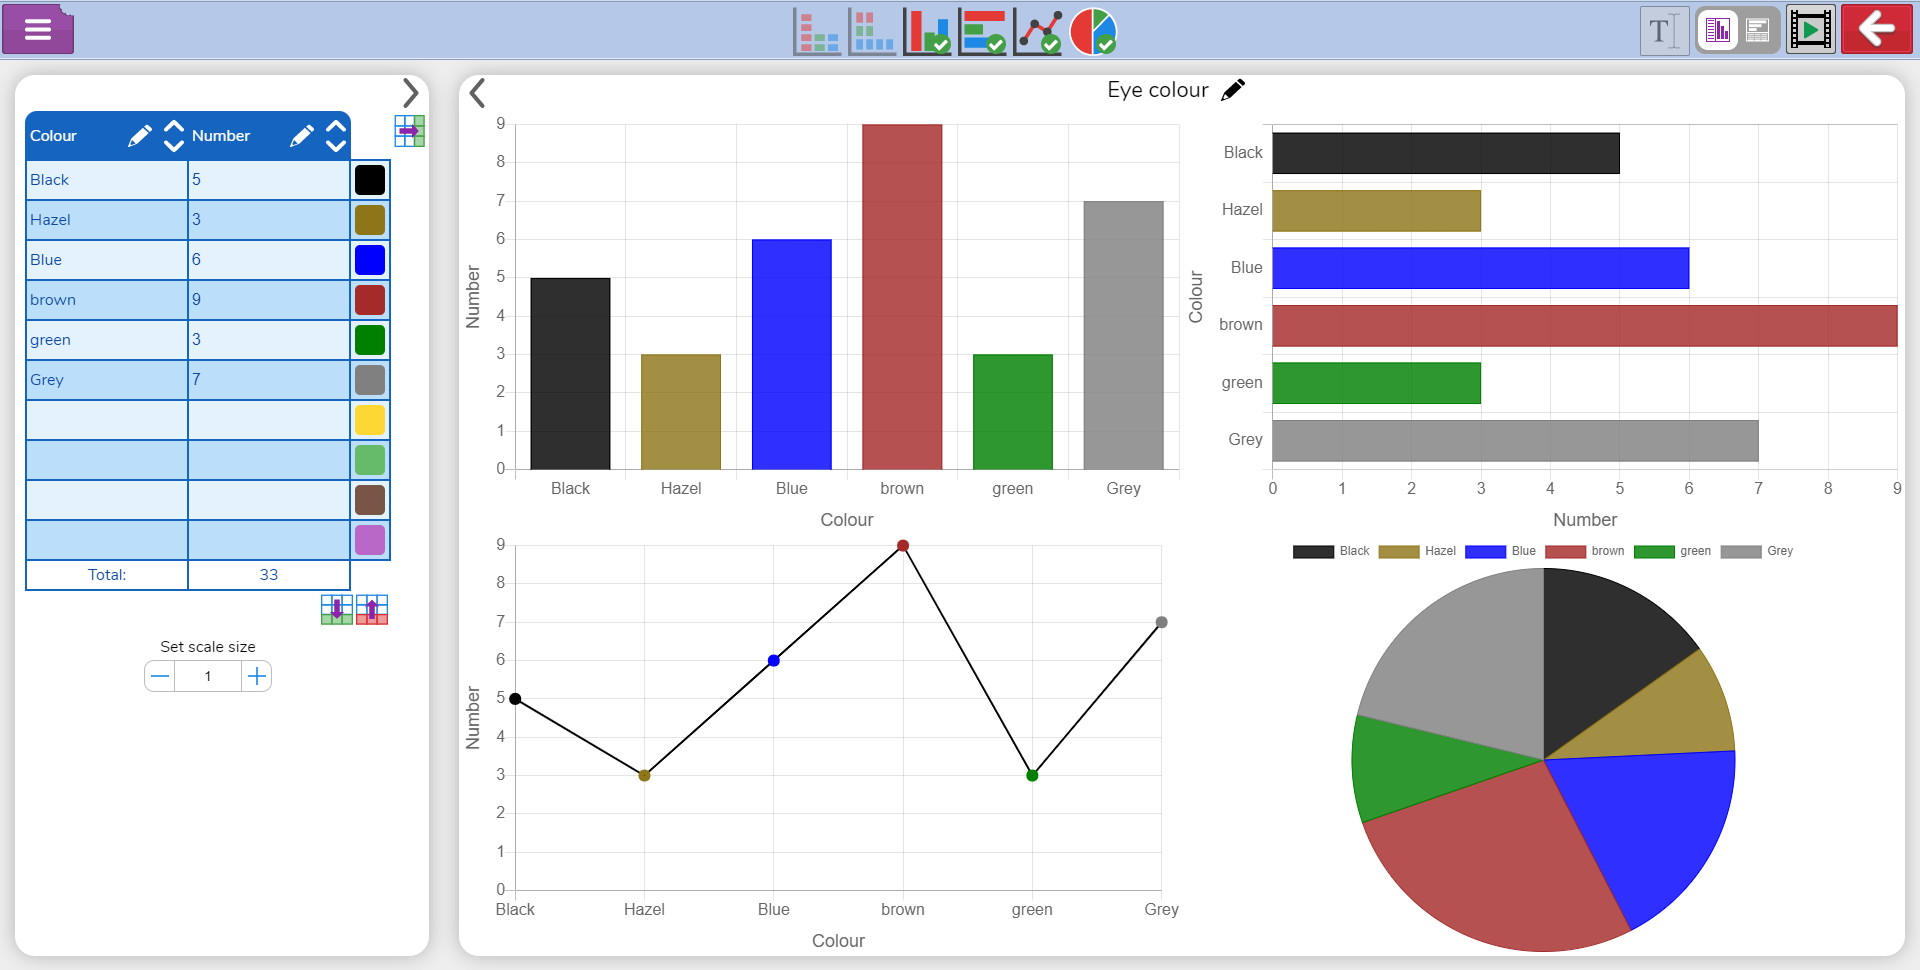
We’ve updated the interface to make it more intuitive and included more layout options. Look at these lovely screenshots below.
View multiple graph types simultaneously
You now have the ability to view up to four graph types at the same time. This is achieved by entering data and then selecting the graph types you want to see from the top bar.
Add multiple data sets
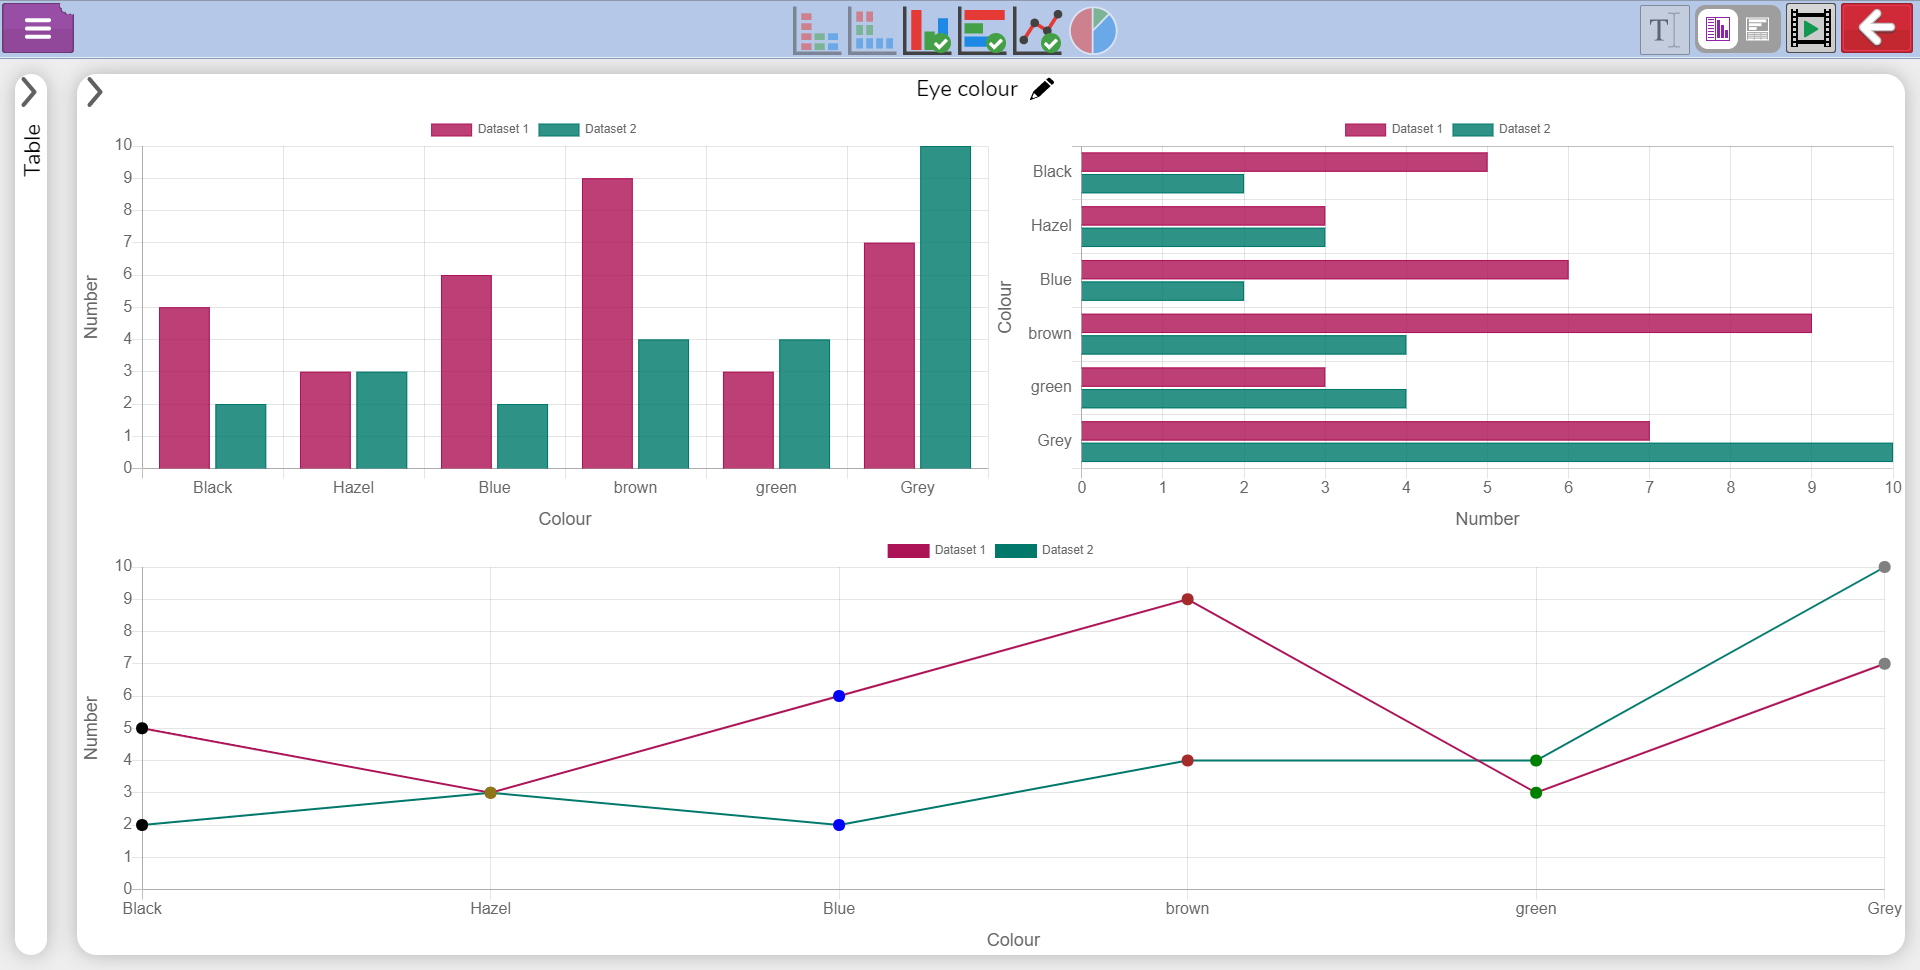
You can now add different sets to the same graphs. Combine this with the multiple graph functionality to really spice things up.

Viewing multiple graphs simultaneously in 2Graph

Viewing graphs full screen
View graph or table as full screen
Simply use the arrows to collapse additional panels and view your graphs at full screen.
Add notes and questions
If you think of a question or comment while reviewing your data, you can now add notes directly to your figures by clicking on the pencil icon in the tool bar.
Stack graphs and tables vertically
Don’t like the horizontal layout, or just bored of it? No problem! Just switch to vertical view at the click of a button.
Negative numbers
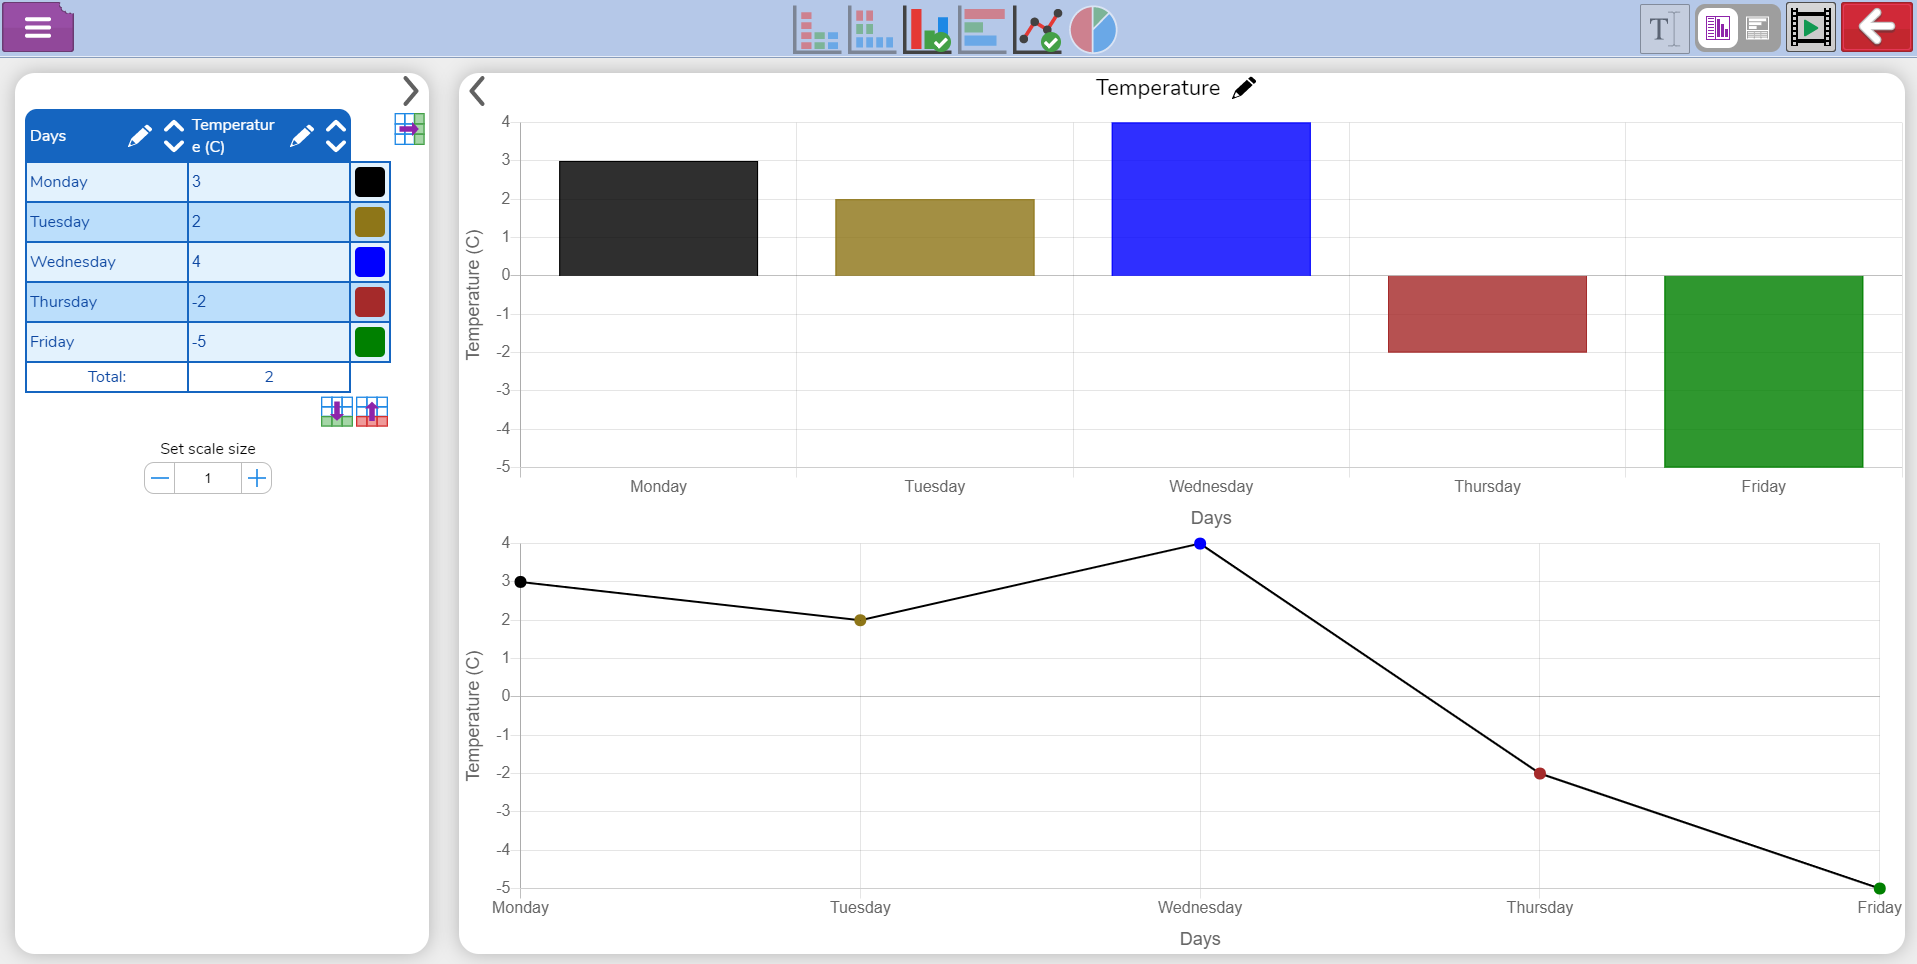
You can add negative integers to your data set alongside positive numbers and everything will be displayed nicely on either side of your 0 axis in the same graph.

Working with negative numbers in 2Graph
More Maths with Purple Mash
2Graph is one of the many maths tools and games within Purple Mash. Visit the Maths and Data Handling area of the Tools section to find everything from pictogramming with 2Count all the way up to 3D Design with 2Design and Make. You’ll also see some great games for children to practice their maths skills, such as Multiplication and 2Race.
We hope you find 2Graph beneficial and would love to hear how your you're getting on via Twitter or Facebook. Happy Purple Mashing!